
Symfony2 Profiler shortcut
Symfony2 Profiler shortcut
Overview
What is Symfony2 Profiler shortcut?
Symfony2 Profiler shortcut.
SCREENSHOT

SUMMARY
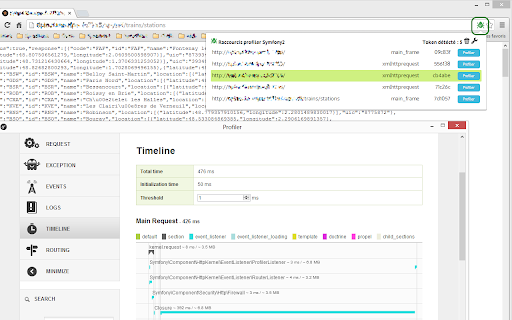
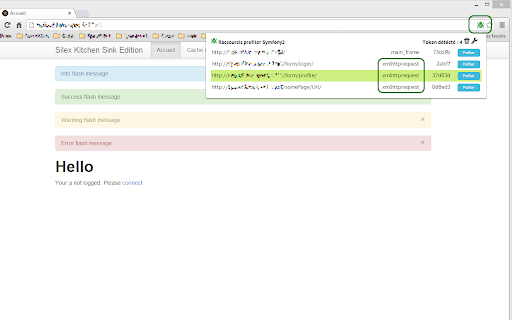
Give access to Symfoy 2 Profiler if any Response from a server is made with the "X-Debug-Token". Very useful for REST & AJAX Development/testing # Last update : - No more 404 with the profiler url picker - UI performance improved # In details This is an extension that help developer and/or tester to see relevant information on Symfony 2 based applications. When you enable debug mode, you probably noticed a toolBar at the bottom. Very useful, clicking on it lead the the Profiler. The profiler make easy to access logs and many information about the current request. This extension is here to allow you to access easily to the fofiler event if the debug toolbar is disabled or not shown. If you already made REST application with Symfony2 framework, you know that the Debug tool bar only show up if you render a real webPage. If you render JSON or XML, you just have the result and to go to the Profiler is a long way. Actually, if you look at the Response headers, you'll notice a "X-Debug-Token:0b274e"; This is the key to go to the debugger. This extension can help you to open the profiler of AJAX/XHR request made on your website.
See More
Stats
Trends for Symfony2 Profiler shortcut:
Rank
User count
Category Rank
Rating
Download
HOW TO INSTALL Symfony2 Profiler shortcut FROM A CRX FILE
- Download Symfony2 Profiler shortcut CRX file
- NOTE: Sometimes the browser may block downloading / installing CRX file from outside the Chrome Web Store. If so, you may need to download the ZIP file instead
- In the URL bar, go to chrome://extensions
- Enable Developer mode
Ratings
USER REVIEWS (0)
No reviews
